6  Longitudinal analysis

6.1 A random slope model

We have been focussing on grouping in the observation. Other types of dependencies can exist within data sets. A very common one is several observations over time on the same subject.

The chicken data contain 4 time points at which the chickens have been weighted. It requires a bit or reorganization to visualize the change in weight over time. Luckily it is the same reorganization that will be needed to fit longitudinal models.
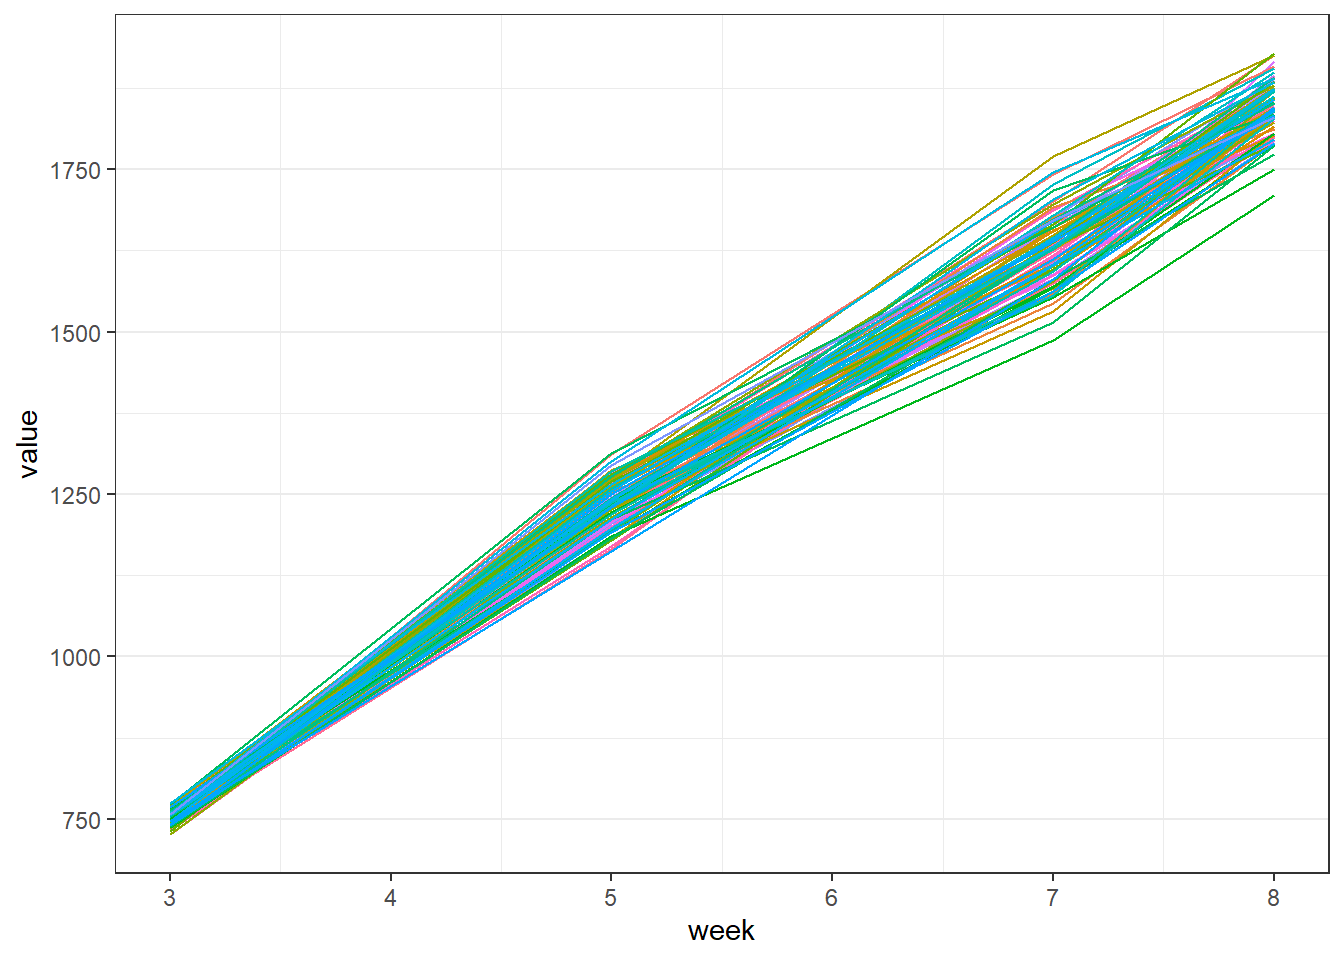
chickensL <-  chickens %>% pivot_longer(cols=c(startweight,week5,week7,endweight),names_to = "time") %>% 
  mutate(week = case_when(time == "startweight" ~3,
                          time == "week5" ~ 5,
                          time == "week7"~7,
                          time == "endweight" ~8,
                          TRUE ~ 0)) 
chickensL$supplier <- relevel(chickensL$supplier,ref="Our104")

chickensL %>% 
  ggplot(aes(y=value,x=week,color=cage,group=chicken)) + 
  geom_line() + 
  theme_bw() + 
  theme(panel.grid.major.x = element_blank(),legend.position = "none")

The graph shows a steady increase in weight of the chickens. Depending on what the purpose is of the repeated measurements, we could opt for different models.

We could consider the repeated measurements as a mean to improve the accuracy by having more measurements. Time could be a random factor in that situation, similar to the models we have seen in previous chapters.

Another reason could be to compare the growth rates obtained with the various feeds. In that case time can be added as factor in other to obtain a random slope, in addition to a random intercept for each chicken. These models are called random slope models. In lmer it is indicated via (1+week|chicken).

modlmer.L2 <- lmer(data=chickensL,value ~ supplier + (1|cage) +
                     (1+week|chicken),
                   control = lmerControl(optimizer = "Nelder_Mead"))
boundary (singular) fit: see help('isSingular')
summary(modlmer.L2,correlation=FALSE)
Linear mixed model fit by REML ['lmerMod']
Formula: value ~ supplier + (1 | cage) + (1 + week | chicken)
   Data: chickensL
Control: lmerControl(optimizer = "Nelder_Mead")

REML criterion at convergence: 4088.2

Scaled residuals: 
    Min      1Q  Median      3Q     Max 
-1.8174 -0.5739 -0.1146  0.5086  2.7879 

Random effects:
 Groups   Name        Variance Std.Dev. Corr 
 chicken  (Intercept) 796267   892.34        
          week         46420   215.45   -1.00
 cage     (Intercept)      0     0.00        
 Residual               1293    35.95        
Number of obs: 352, groups:  chicken, 88; cage, 22

Fixed effects:
              Estimate Std. Error t value
(Intercept)   1014.443      4.785 212.011
supplierAV102    9.198      7.566   1.216
supplierBK77    -6.071      7.566  -0.803
supplierCM10    11.929      7.566   1.577
supplierLG22     2.873      7.566   0.380
optimizer (Nelder_Mead) convergence code: 0 (OK)
boundary (singular) fit: see help('isSingular')

In the output, the random effects reflects the grouping: a classic grouping effect (intercept only) for cage and a regression (with intercept and slope) for chicken. The cage is so small it got absorbed elsewhere.

The fixed effect provides the level of the reference feed and the deviations caused by the various feeds. The reference level is reflecting the weight at some intermediate time point (the average of 3, 5, 7 and 8 weeks).

An alternative model is by considering time as a fixed effect as well. The observations of a particular chicken are reasonably linear, hence a linear regression model for the fixed effects makes sense. The random slope model will allow by-chicken random deviations from the main fixed slope (one for each supplier). The cage random effect will still be included.

modlmer.L3 <- lmer(data=chickensL,value ~ supplier*week + (1|cage) + (1+week|chicken),control = lmerControl(optimizer = "Nelder_Mead"))
boundary (singular) fit: see help('isSingular')
summary(modlmer.L3,correlation=FALSE)
Linear mixed model fit by REML ['lmerMod']
Formula: value ~ supplier * week + (1 | cage) + (1 + week | chicken)
   Data: chickensL
Control: lmerControl(optimizer = "Nelder_Mead")

REML criterion at convergence: 3519.9

Scaled residuals: 
    Min      1Q  Median      3Q     Max 
-2.1932 -0.6454 -0.2135  0.5436  2.7803 

Random effects:
 Groups   Name        Variance  Std.Dev.  Corr 
 chicken  (Intercept) 1.521e+02 1.233e+01      
          week        3.336e+01 5.775e+00 -1.00
 cage     (Intercept) 2.635e-07 5.133e-04      
 Residual             1.152e+03 3.394e+01      
Number of obs: 352, groups:  chicken, 88; cage, 22

Fixed effects:
                   Estimate Std. Error t value
(Intercept)        110.3844    11.2224   9.836
supplierAV102       22.9179    17.7441   1.292
supplierBK77        32.1231    17.7441   1.810
supplierCM10        18.8303    17.7441   1.061
supplierLG22         4.9343    17.7441   0.278
week               218.1237     2.1551 101.214
supplierAV102:week  -3.3103     3.4075  -0.971
supplierBK77:week   -9.2153     3.4075  -2.704
supplierCM10:week   -1.6651     3.4075  -0.489
supplierLG22:week   -0.4974     3.4075  -0.146
optimizer (Nelder_Mead) convergence code: 0 (OK)
boundary (singular) fit: see help('isSingular')

In the fixed effects part we now get also a slope by supplier. BK77 starts high but has a slower gain in the course of the experiment. The random effect for week is much lower, because majority of the variability is absorbed by the fixed effect.

Remark that the intercept has changed. It now is an actual intercept and reflects the weight at time zero. This is not so interesting information. Therefore it is usually more informative to rescale the time and set 0 where it provides useful information. For instance, have the intercept at time point week = 5, would make it comparable to the previous model. Any interesting time point can be chosen for this purpose.

chickensL <- chickensL %>% 
  mutate(week_shifted = week - 5)

modlmer.L3_shifted <- lmer(data=chickensL,value ~ supplier*week_shifted +
            (1|cage) + (1+week_shifted|chicken),
            control = lmerControl(optimizer = "Nelder_Mead"))
boundary (singular) fit: see help('isSingular')
summary(modlmer.L3_shifted)$coefficients
                               Estimate Std. Error     t value
(Intercept)                1201.0030367   5.023499 239.0770117
supplierAV102                 6.3665607   7.942849   0.8015463
supplierBK77                -13.9531427   7.942849  -1.7566925
supplierCM10                 10.5045904   7.942849   1.3225218
supplierLG22                  2.4474929   7.942849   0.3081379
week_shifted                218.1237288   2.155067 101.2143642
supplierAV102:week_shifted   -3.3102754   3.407460  -0.9714789
supplierBK77:week_shifted    -9.2152542   3.407460  -2.7044350
supplierCM10:week_shifted    -1.6651483   3.407460  -0.4886773
supplierLG22:week_shifted    -0.4973517   3.407460  -0.1459597

Obviously, the more we shift the intercept to the end, the bigger the impact of the slower growth of BK77 has on the weight.

chickensL <- chickensL %>% 
  mutate(week_shifted = week - 7.5)

modlmer.L3_shifted <- lmer(data=chickensL,value ~ supplier*week_shifted +
                (1|cage) + (1+week_shifted|chicken),
                control = lmerControl(optimizer = "Nelder_Mead"))
boundary (singular) fit: see help('isSingular')
summary(modlmer.L3_shifted)$coefficients
                               Estimate Std. Error     t value
(Intercept)                1746.3123588   7.871659 221.8480784
supplierAV102                -1.9091278  12.446185  -0.1533906
supplierBK77                -36.9912782  12.446185  -2.9720977
supplierCM10                  6.3417196  12.446185   0.5095312
supplierLG22                  1.2041137  12.446185   0.0967456
week_shifted                218.1237288   2.155064 101.2144867
supplierAV102:week_shifted   -3.3102754   3.407456  -0.9714801
supplierBK77:week_shifted    -9.2152542   3.407456  -2.7044383
supplierCM10:week_shifted    -1.6651483   3.407456  -0.4886779
supplierLG22:week_shifted    -0.4973517   3.407456  -0.1459598

We could think about another model where the deviation from the slope is linked to the cage rather than to the chicken, but apparently the extra parameter fitted by modlmer.L3 is justified as shown by anova() of the competing models.

modlmer.L4 <- lmer(data=chickensL,value ~ supplier*week + 
                     (1+week|cage) ,
                   control = lmerControl(optimizer = "Nelder_Mead"))
boundary (singular) fit: see help('isSingular')
summary(modlmer.L4)
Linear mixed model fit by REML ['lmerMod']
Formula: value ~ supplier * week + (1 + week | cage)
   Data: chickensL
Control: lmerControl(optimizer = "Nelder_Mead")

REML criterion at convergence: 3540.5

Scaled residuals: 
    Min      1Q  Median      3Q     Max 
-2.7957 -0.6260 -0.1960  0.5934  2.9421 

Random effects:
 Groups   Name        Variance Std.Dev. Corr 
 cage     (Intercept)  199.2   14.115        
          week          22.7    4.765   -1.00
 Residual             1487.7   38.570        
Number of obs: 352, groups:  cage, 22

Fixed effects:
                   Estimate Std. Error t value
(Intercept)        110.3844    13.6983   8.058
supplierAV102       22.9179    21.6590   1.058
supplierBK77        32.1231    21.6590   1.483
supplierCM10        18.8303    21.6590   0.869
supplierLG22         4.9343    21.6590   0.228
week               218.1237     2.8259  77.186
supplierAV102:week  -3.3103     4.4682  -0.741
supplierBK77:week   -9.2153     4.4682  -2.062
supplierCM10:week   -1.6651     4.4682  -0.373
supplierLG22:week   -0.4974     4.4682  -0.111

Correlation of Fixed Effects:
            (Intr) spAV102 spBK77 spCM10 spLG22 week   sAV102: sBK77: sCM10:
supplrAV102 -0.632                                                          
supplirBK77 -0.632  0.400                                                   
supplirCM10 -0.632  0.400   0.400                                           
supplirLG22 -0.632  0.400   0.400  0.400                                    
week        -0.914  0.578   0.578  0.578  0.578                             
spplrAV102:  0.578 -0.914  -0.366 -0.366 -0.366 -0.632                      
spplrBK77:w  0.578 -0.366  -0.914 -0.366 -0.366 -0.632  0.400               
spplrCM10:w  0.578 -0.366  -0.366 -0.914 -0.366 -0.632  0.400   0.400       
spplrLG22:w  0.578 -0.366  -0.366 -0.366 -0.914 -0.632  0.400   0.400  0.400
optimizer (Nelder_Mead) convergence code: 0 (OK)
boundary (singular) fit: see help('isSingular')
anova(modlmer.L3,modlmer.L4)
refitting model(s) with ML (instead of REML)
Data: chickensL
Models:
modlmer.L4: value ~ supplier * week + (1 + week | cage)
modlmer.L3: value ~ supplier * week + (1 | cage) + (1 + week | chicken)
           npar    AIC  BIC  logLik deviance  Chisq Df Pr(>Chisq)    
modlmer.L4   14 3616.9 3671 -1794.5   3588.9                         
modlmer.L3   15 3595.0 3653 -1782.5   3565.0 23.918  1  1.005e-06 ***
---
Signif. codes:  0 '***' 0.001 '**' 0.01 '*' 0.05 '.' 0.1 ' ' 1

6.2 Predictions and bootstraps of more complex questions

The model output becomes more complex, and usually what we actually need can not be found directly in the default model output. The current output is about weights at week 0 (not clear what this actually means…) and a slope. Suppose that chickens are normally slaughtered after 7 and a half weeks. Predictions of the weights at that time would be handy.

A new dataset with same names as the original data set but with the new levels of interest is created and provide to the predict() function.

# prediction
nd <- data.frame(supplier = levels(chickensL$supplier),week=7.5)
nd <- nd %>% mutate(pred = predict(modlmer.L3,newdata=nd,re.form = NA))
nd
  supplier week     pred
1   Our104  7.5 1746.312
2    AV102  7.5 1744.403
3     BK77  7.5 1709.321
4     CM10  7.5 1752.654
5     LG22  7.5 1747.516

If we apply this in combination with a bootstrap, we obtain confidence intervals on these predictions.

# prediction + bootstraps can be used to find confidence intervals

nd <- data.frame(supplier = levels(chickensL$supplier),week=7.5)

bootfun <- function(mod){
  predict(mod,newdata=nd,re.form = NA)
}

bs <- bootMer(modlmer.L3,bootfun,nsim=500)
str(bs$t)
 num [1:500, 1:5] 1741 1758 1740 1735 1751 ...
 - attr(*, "dimnames")=List of 2
  ..$ : NULL
  ..$ : chr [1:5] "1" "2" "3" "4" ...

Confidence intervals (95%) are obtained by calculating the 0.025th and 0.975th quantiles of the bootstrapped estimates.

bs.ci <- apply(bs$t,2,quantile,c(0.025,0.975)) %>% t()
bind_cols(nd,bs.ci)
  supplier week     2.5%    97.5%
1   Our104  7.5 1730.272 1761.426
2    AV102  7.5 1727.163 1764.138
3     BK77  7.5 1689.590 1728.992
4     CM10  7.5 1732.624 1770.455
5     LG22  7.5 1728.683 1768.078

Starting from the bootstrapped estimates, other contrasts or derived values can be calculated. For instance but for the difference with the reference (i.e. the first element of the extraction).

bs.dif <- bs$t - bs$t[,1]
bind_cols(nd,
          apply(bs.dif,2,quantile,c(0.5,0.025,0.975)) %>% t() 
)
  supplier week        50%      2.5%     97.5%
1   Our104  7.5   0.000000   0.00000   0.00000
2    AV102  7.5  -2.155613 -26.13809  23.75040
3     BK77  7.5 -37.164026 -60.79214 -11.33729
4     CM10  7.5   5.498147 -19.43064  30.66697
5     LG22  7.5   1.100094 -24.47240  25.83693

Hence the output is similar as what we obtained by shifting the intercept (modlmer.L3_shifted). The advantage of doing it this way is it general applicability. This is an illustration of a more general way of extracting some complex contrast (or proportion for instance) from mixed models.

6.3 More complex dependencies in time

Obviously the previous approach is only practical when there is some simple relationship that can be modelled in the fixed effect and/or a slope.

In the situation where there is no linear relationship other options are available.

One option is to model the time as an autoregressed effect: models with a correlation between an observation and the previous observation on the same subject. All subjects can evolve independently along its own pattern. They are typically fitted with the packages nlme or brms. The latter we will explain later in this chapter.

When the observations follow a pattern, particularly when that pattern has common features among the subjects, generalized additive models can be used. These models have also mixed variants. See package gamm4. This we will not treat in this course.

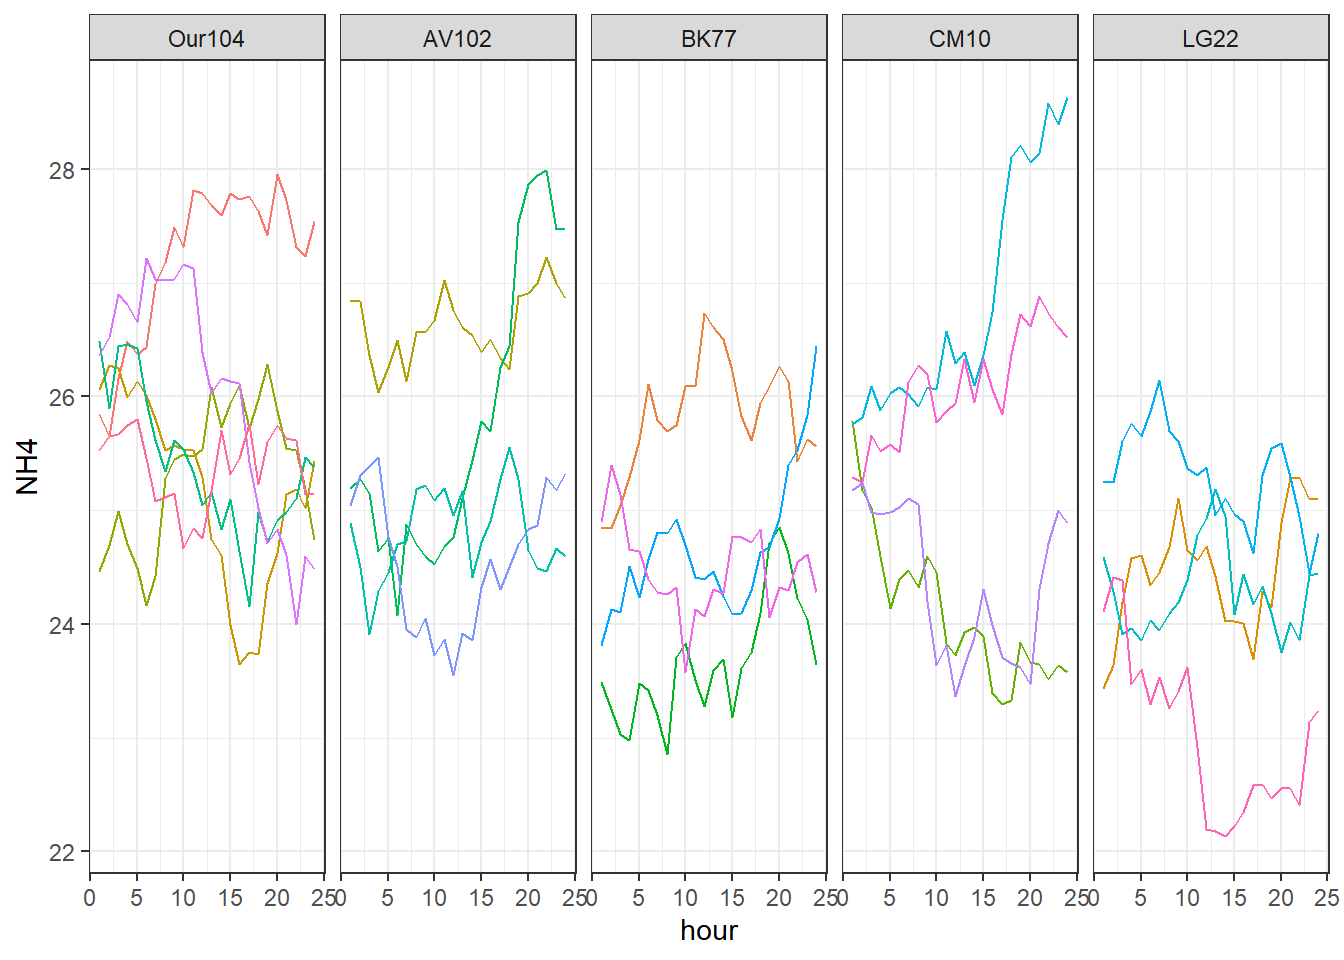
The chicken experiment also measured ammonia release from the cages. During an entire day, at every hour, air samples haven taken and analysed for ammonia. The results are in a separate data set (get it here) and is plotted below.

load("data/chickensNH4.obj")
head(chickensNH4,10)
     cage supplier       T1       T2       T3       T4       T5       T6
1   cage1   Our104 25.84889 25.64946 26.16047 26.49040 26.37392 26.43103
5   cage2     LG22 24.58543 24.28741 23.90748 23.96728 23.86097 24.03287
9   cage3    AV102 25.04441 25.30906 25.39158 25.46937 24.76123 24.51243
13  cage4     CM10 25.17784 25.24084 24.98646 24.96752 24.98144 25.02687
17  cage5   Our104 26.36304 26.52283 26.90266 26.80994 26.65759 27.21246
21  cage6     BK77 24.89994 25.39914 25.14000 24.66055 24.64244 24.39040
25  cage7     CM10 25.28903 25.24940 25.66253 25.51801 25.58542 25.50907
29  cage8     LG22 24.11119 24.41447 24.38275 23.47577 23.60511 23.29579
33  cage9   Our104 25.52494 25.65482 25.66924 25.74496 25.79791 25.45670
37 cage10     BK77 24.83935 24.84130 25.04279 25.29535 25.61297 26.11028
         T7       T8       T9      T10      T11      T12      T13      T14
1  26.98714 27.18004 27.48991 27.31584 27.81818 27.79224 27.68489 27.59869
5  23.94484 24.09560 24.19230 24.38598 24.77969 24.93419 25.18965 24.94599
9  23.95591 23.88369 24.05052 23.72386 23.86334 23.54715 23.91860 23.86044
13 25.10503 25.05264 24.20112 23.63757 23.81188 23.36602 23.63297 23.88337
17 27.03348 27.01939 27.03294 27.16789 27.13191 26.39277 26.03225 26.15831
21 24.28156 24.26674 24.32264 23.57890 24.13294 24.06977 24.30305 24.26943
25 26.12855 26.27802 26.20098 25.77395 25.87409 25.94576 26.32546 25.94837
29 23.52982 23.25629 23.40827 23.62262 22.91531 22.19364 22.17961 22.13113
33 25.07807 25.11414 25.15258 24.66928 24.84393 24.75870 25.17205 25.70254
37 25.78859 25.69786 25.74645 26.09422 26.09117 26.72954 26.61311 26.50186
        T15      T16      T17      T18      T19      T20      T21      T22
1  27.78695 27.73447 27.76078 27.63298 27.41724 27.95219 27.72388 27.30919
5  24.08974 24.43819 24.17780 24.32932 24.09246 23.75248 24.01414 23.86120
9  24.32756 24.57441 24.30386 24.49749 24.69906 24.83518 24.87333 25.29534
13 24.30683 23.98933 23.70468 23.65571 23.61911 23.47276 24.30992 24.71098
17 26.13610 26.12048 25.41904 25.01681 24.70957 24.83181 24.60976 24.00013
21 24.77479 24.76397 24.72130 24.83025 24.05948 24.32520 24.29563 24.54248
25 26.33281 26.06795 25.84249 26.37331 26.72012 26.61558 26.88652 26.73327
29 22.22420 22.34927 22.58054 22.58960 22.47324 22.55554 22.55774 22.41132
33 25.31921 25.45941 25.76008 25.22717 25.60328 25.74666 25.63076 25.61881
37 26.22257 25.82842 25.61927 25.94282 26.08909 26.27082 26.13549 25.43144
        T23      T24
1  27.23293 27.54586
5  24.43224 24.44420
9  25.18120 25.32640
13 24.99875 24.88872
17 24.59558 24.48029
21 24.61545 24.28182
25 26.61195 26.51799
29 23.13529 23.24095
33 25.14572 25.13827
37 25.62411 25.56797
chickensNH4L <-  chickensNH4 %>% 
  pivot_longer(cols=starts_with("T"),names_to = "time",values_to = "NH4") %>% 
  mutate(hour = as.numeric(sub("T","",time)))
chickensNH4L$supplier <- relevel(chickensNH4L$supplier,ref="Our104")

chickensNH4L %>% ggplot(aes(y=NH4,x=hour,group=cage,colour=cage)) + 
  geom_line() + 
  facet_wrap(~supplier,nrow=1) + 
  theme_bw() + 
  guides(color="none")

From the graph it is clear that the observations are not independent (an observation resembles the one from an hour before). We need models that acknowledge correlations between adjacent observations, but we cannot use the simple linear relationship with time.

Here we get in another type of mixed models where observations are not (only) grouped but have a continuous tight or less tight relationship.

We will use brms to illustrate this. And fir three models: one that ignores all dependencies (the classic fixed model), a model that considered only the grouping effect of cages, and a third one that additionally models observations from a same cage with a autoregressive or AR connection among them, meaning that observations are correlated to the observations that happened before (on the same subject). In this case, we ask for just for AR1, that is only the previous observation is considered (ar(..., p=1). We could ask for more (p = 2 or 3). An additional parameter ϕ is entered in the model. It models the dependency as ϕ1,ϕ2,... with the exponent being the order of separation in the time series. When ϕ is smaller than 1 this gives an ever further decreasing correlation.

We compare three models: one assuming total independence, one assuming grouping by cage, and finally one that assumes grouping by cage and an AR1 between consecutive measurements.

mar.1.brms <- brm(data=chickensNH4L,
                  NH4 ~ supplier)
Compiling Stan program...
Start sampling
mar.2.brms <- brm(data=chickensNH4L,
                  NH4 ~ supplier + (1|cage))
Compiling Stan program...
Start sampling
mar.3.brms <- brm(data=chickensNH4L,
                  NH4 ~ supplier + (1|cage) + 
                    ar(time=hour,gr=cage,p=1))
Compiling Stan program...
Start sampling

The random effects:

VarCorr(mar.1.brms)
$residual__
$residual__$sd
 Estimate  Est.Error     Q2.5    Q97.5
 1.076142 0.03286084 1.012702 1.142961
VarCorr(mar.2.brms)
$cage
$cage$sd
          Estimate Est.Error      Q2.5    Q97.5
Intercept 1.032309   0.19443 0.7287898 1.494964


$residual__
$residual__$sd
  Estimate  Est.Error      Q2.5     Q97.5
 0.6612868 0.02014031 0.6235509 0.7024772
VarCorr(mar.3.brms)
$cage
$cage$sd
          Estimate Est.Error     Q2.5    Q97.5
Intercept 0.687795 0.1592136 0.433213 1.056362


$residual__
$residual__$sd
 Estimate  Est.Error      Q2.5     Q97.5
 0.320525 0.01014566 0.3015987 0.3414646

and the fixed effects:

fixef(mar.1.brms)
                Estimate  Est.Error       Q2.5       Q97.5
Intercept     25.7519539 0.09020797 25.5750001 25.92884465
supplierAV102 -0.3184141 0.14450376 -0.6000219 -0.02660032
supplierBK77  -1.0917733 0.14160898 -1.3739353 -0.81872741
supplierCM10  -0.4126509 0.14147019 -0.6866599 -0.13743325
supplierLG22  -1.4833485 0.14440725 -1.7659821 -1.20218329
fixef(mar.2.brms)
                Estimate Est.Error      Q2.5      Q97.5
Intercept     25.7611340 0.4450599 24.897039 26.6812813
supplierAV102 -0.3084372 0.6957981 -1.740085  0.9777637
supplierBK77  -1.0764638 0.6862877 -2.453307  0.2620938
supplierCM10  -0.4231571 0.6897801 -1.838716  0.9465434
supplierLG22  -1.4938742 0.6852717 -2.843985 -0.1762913
fixef(mar.3.brms)
                Estimate Est.Error      Q2.5      Q97.5
Intercept     25.7790226 0.3116906 25.172247 26.4013341
supplierAV102 -0.2846899 0.5093107 -1.356792  0.7435729
supplierBK77  -1.4996667 0.4916426 -2.517764 -0.5283978
supplierCM10  -0.2658377 0.4953813 -1.261552  0.7032717
supplierLG22  -1.4282290 0.4950486 -2.393725 -0.4265818

The last two models have a random group effect cage.

The code in the chunks below extracts the blups for the cages (the part ranef()).

The rest of the code is not meant to provide directly interpretable output, but is used her solely to show that there is even more shrinking in the model with an autoregression component mar.3.brms which leads to stabilization. Which illustrates that modelling the dependence helps.

ranef(mar.2.brms)$cage %>% 
  as_tibble(rownames = "cage") %>% 
  inner_join(chickensNH4L %>% 
               select(supplier,cage) %>% distinct(),by="cage") %>%
  group_by(supplier) %>% 
  summarise(sdcage=sd(Estimate.Intercept),meanerror=mean(Est.Error.Intercept))
# A tibble: 5 × 3
  supplier sdcage meanerror
  <fct>     <dbl>     <dbl>
1 Our104    0.755     0.456
2 AV102     0.933     0.538
3 BK77      0.871     0.530
4 CM10      1.30      0.533
5 LG22      0.925     0.526
ranef(mar.3.brms)$cage %>% 
  as_tibble(rownames = "cage") %>% 
  inner_join(chickensNH4L %>% 
               select(supplier,cage) %>% distinct(),by="cage") %>%
  group_by(supplier) %>% 
  summarise(sdcage=sd(Estimate.Intercept),meanerror=mean(Est.Error.Intercept))
# A tibble: 5 × 3
  supplier sdcage meanerror
  <fct>     <dbl>     <dbl>
1 Our104    0.585     0.390
2 AV102     0.726     0.444
3 BK77      0.568     0.430
4 CM10      0.254     0.433
5 LG22      0.609     0.428